Hypothesis Testing : t-statistics
Hypothesis testing is a way by which we accept or decline a claim about the population on the basis of sample we collected. In statistical terms, it’s called making inferences about the population by using sample data collected randomly from the population. It starts by stating two hypotheses - Null Hypothesis and Alternative Hypothesis. When making claims about the population, under Null hypothesis, it’s assumed that there is no change in the population. But on the contrary, Alternative hypothesis is proposed which claims there is in fact a change in the population. To support this claim, sample is collected and analysed. After analysis, t-statistics and p-value are calculated. On the basis of p-value, either the claim is accepted or rejected.
Today I’m discussing about t-test, which involves calculating t-statistics. Moreover, I will be showing the types of t-tests and when and how to use it. T-test is one of inferential methods which is used when we need to find difference between two groups or to see any effect of drugs or medicine, if there is, in a group before or after its applied. I’m using sleep dataset, which contains 2 groups of people with 10 on each. This dataset records sleeping hours. I’m going to see if there is any difference on sleeping hours on average between 2 groups. Furthermore, I’m also testing to see if there is any effect on sleeping hours after certain drugs were used as an experiment.
data(sleep)

sleep
# extra group ID
# 1 0.7 1 1
# 2 -1.6 1 2
# 3 -0.2 1 3
# 4 -1.2 1 4
# 5 -0.1 1 5
# 6 3.4 1 6
# 7 3.7 1 7
# 8 0.8 1 8
# 9 0.0 1 9
# 10 2.0 1 10
# 11 1.9 2 1
# 12 0.8 2 2
# 13 1.1 2 3
# 14 0.1 2 4
# 15 -0.1 2 5
# 16 4.4 2 6
# 17 5.5 2 7
# 18 1.6 2 8
# 19 4.6 2 9
# 20 3.4 2 10Check our sample data is normally distributed
One of the major assumptions we have to make while doing t-test is, our data is normally distributed. We normally start by checking whether our sample data collected follows this discipline. I can use qqPlot to see if it’s the case
qqPlot(sleep$extra,col = sleep$group,main = "Q-QPlot", ylab = "Extra")
# [1] 17 2As seen from the figure, most of the data points are all between those 2 belts, thus it can be concluded that our data follows normal distribution.
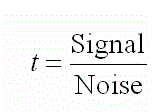
In all of t-tests, we calculate t-statistics first. Later this value calculated from our sample is used to find where it falls on the t-distribution. For simplicity, we can assume it as ratio between Signal to Noise.

As you can see higher the signal, higher the t-value. And higher the t-value, stronger evidence there is to reject the Null hypothesis.
Types of t-test
There are different flavours of t-test and which one to use depends on what you are trying to find out.
One-Sample test
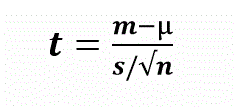
This test is used to find out to see if there is any change on population on average against the hypothesized value. For example, suppose there is a claim about the mean height of male in certain group and this claim is based on past year. This is the hypothesized value. I can see if this is still valid today by using this test. Mathematically, it’s represented as

- t = t-statistic
- m = sample mean
- µ = hypothesized population mean
- s = standard deviation of sample
- n = sample size
In our case, let’s assume that there is a hypothesized claim that the sleeping hours have increased. I can see if there is any average difference on sleeping hours in general. Let’s put these into our hypotheses and start testing.
- Null hypothesis = there is no difference on average sleeping hours in general.
- Alternative hypothesis = there is difference
t.test(sleep$extra, alternative = "greater")#
# One Sample t-test
#
# data: sleep$extra
# t = 3.413, df = 19, p-value = 0.001459
# alternative hypothesis: true mean is greater than 0
# 95 percent confidence interval:
# 0.7597797 Inf
# sample estimates:
# mean of x
# 1.54Here the t-statistic is 3.413 and p-value is 0.0014. The p-value is smaller than 0.05, which is way below cut-off (alpha) level so; I can reject the Null hypothesis.
P-value is the probability of finding how likely is that what I saw in the result is just by luck. There is often saying P-value is low, so Null must go. The lower p-value suggests, our result is statistically significant and provides the strong evidence to reject the Null hypothesis. With this I can conclude that there indeed a strong statistically significant difference in general on sleeping hours on average.
Independent Two-Sample test
This test is used if we want to compare on something between two groups. In our case I want to see on average if there is any difference on sleeping hours between two groups. Mathematically,it is represented as:

- mA and mB are sample means
- nA and nB are sample sizes
- S2 = estimator of common variance of samples
To use this test, first I’m going to separate sleeping hours between 2 groups. Again let’s state our hypotheses about the population and start testing.
- Null hypothesis = there is no difference on sleeping hours between groups on average
- Alternative hypothesis = there is difference
first_group<- sleep[sleep$group == 1 , "extra"]
second_group<- sleep[sleep$group == 2 , "extra"]

t.test(first_group, second_group)
#
# Welch Two Sample t-test
#
# data: first_group and second_group
# t = -1.8608, df = 17.776, p-value = 0.07939
# alternative hypothesis: true difference in means is not equal to 0
# 95 percent confidence interval:
# -3.3654832 0.2054832
# sample estimates:
# mean of x mean of y
# 0.75 2.33The result shows p-value is greater than 0.05, so I fail to reject the Null hypothesis. This indicates there isn’t any significant difference between average sleep hours between those 2 groups of people.
One thing to note here is, its assumed by default that both the groups have different variances. When variances are assumed to be different, this test is often called Welch Two Sample t-test. But I can supply var.equal = TRUE, to suggest the groups have equal variance.
Paired Sample test
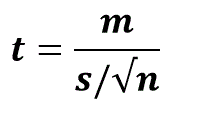
This test is often used to see if there is any effect in a group before and after certain experiment is performed. Suppose a new drug is developed and we want to see if there is any effect of this drug. We take a sample randomly from the population and measure their performance (in our case sleeping hours) After that we give drugs to them. Later we measure their performance and test to see if there is any average difference on performance. Mathematically, it is shown as

- t = t-statistic
- m = sample mean
- s = standard deviation of sample
- n = sample size
In our case, I use this test to find out the effect of certain drugs on same group of people which I separated before. Here, first_group represents group before the drugs was given and second_group represents the same group after the drugs was given. As usual lets state our hypotheses and run the test.
- Null hypothesis = there is no effect of drugs on average
- Alternative hypothesis = there is effect of drugs on average
t.test(first_group, second_group, paired = TRUE)#
# Paired t-test
#
# data: first_group and second_group
# t = -4.0621, df = 9, p-value = 0.002833
# alternative hypothesis: true difference in means is not equal to 0
# 95 percent confidence interval:
# -2.4598858 -0.7001142
# sample estimates:
# mean of the differences
# -1.58Here p-value is below 0.05. This shows, I can reject the null hypothesis. It gives me strong evidence that the drugs indeed have effect on the sleep on the group. I used paired = TRUE to suggest I’m using Paired t-test.
Finally, by conducting 3 t-tests, what I found is in general there is average difference on sleeping hours but between 2 groups I found there is no significant differences. When I tested to see if there is any effect of drugs, I found there is a significant difference on sleep hours before and after the drugs was given.
Conclusion
We can never measure exact statistics of the population. we can only make guesses from the past. This is when Statistics comes to the rescue. Statistics is such a field of study which enables us to make that guess more scientifically and mathematically robust. Hypothesis testing is one such measure. We can’t measure the whole population but we can take small sample with true representative of the entire population. We then analyse that sample, make some test and formulate some statistics from the sample. Finally, those statistics like t-statistics, p-value are then used to make inferences about the population as the whole.
